亲民维稳热点推荐
- ·汽柴油出口扭亏为盈 石油巨头出口降
- ·维生素出口量萎缩价格下滑--亲稳网络
- ·今年前7月中欧贸易下降0.9%--亲稳舆
- ·我国1-7月矿产资源商品进口量增价跌-
- ·1-6月土耳其为阿第一大贸易进口国--
- ·大闸蟹德国泛滥食客呼吁运回国 进口
- ·今年进口车回暖预计无望--亲稳舆论引
- ·钢铁业无序之忧:一吨钢利润不够买张
- ·美国对华贸易保护主义明显升温--亲稳
- ·日本改从哈萨克斯坦进口稀土--亲稳舆
- ·阿根廷贸易顺差大降--亲稳网络舆情监
- ·取消53种“双高”产品出口退税--亲稳
- ·2012年越俄双边贸易额或达35亿美元--
- ·进出口银行从日本瑞穗融资--亲稳舆论
- ·聚焦紧固件出口退税率--亲民维稳网络
- ·上个月广东外贸进出口开门红评析--亲
即刻使用亲民维稳解决方案!

发掘汇报软件
使用亲民维稳全套解决方案邀请
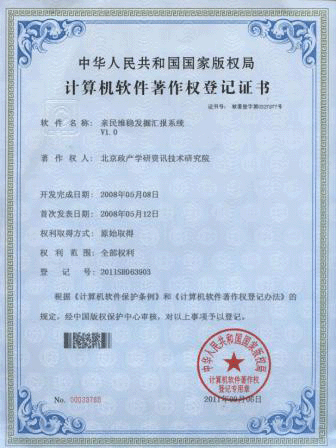
亲稳发掘汇报系统
全球制造业出口贸易发展趋势(一)(多图)--亲民维稳网络舆情监测室
2012-09-24
贸易扩张是经济全球化的核心。自2004年以来,出口每年上涨5.9%,2008年出口额达到近15万亿美元,随后在2009年出现下降(参见表1)。制造业在世界贸易中占重要的比重,自1990年以来一直在整个出口总额中占据80%以上的份额。
Trade expansion is the core of economic globalization.Since 2004,Exports rose by 5.9% each year,In 2008 the export amountamounted to nearly $15 trillion,Then in 2009 decline(See table 1).Manufacturing industry in the world trade accounted for the proportion of important,Since 1990 has been the whole in the total export accounts for more than 80% of the share.

虽然发达国家在传统上主导世界制造业贸易,但发展中国家的比重也稳步增长,这也使其更易受到贸易冲击(Montalbano 2011)。尽管发展中国家最初躲过了2008~2009年的金融危机的直接影响,但贸易还是受到了影响,在金融危机的严重影响下,发展中国家对发达国家的出口减少。后来,发展中国家在其他方面也受到了危机影响,包括汇付、外商直接投资及发展援助等。
Although the developed countries traditionally dominant world manufacturing trade,But the proportion of developing countries is growing steadily,This has made it more vulnerable to trade impact(Montalbano 2011).Although developing countries first escaped the 2008-2009 financial crisis influence directly,But trade or have been affected,In the financial crisis under the serious influence,Developing countries in the developed countries, and export to reduce.later,Developing countries in other areas is also affected by the crisis influence,Including remittance/Foreign direct investment and development aid, etc.
本章分析了1990年以来世界制造业出口的趋势,发展中国家的角色转变及最近的经济金融危机对其制造业出口的影响。
This chapter analyzes the world manufacturing industry since 1990, the trend of export,Developing countries and the change of the role of the recent economic and financial crisis the influence of manufacturing export.
世界制造业出口趋势
The world manufacturing export trend
2008年,世界制造业出口额达到12.095万亿美元的峰值(参见表1),其增速超过了2005~2009年间制造业增加值和GDP的增速。贸易自由化、交通成本的下降及生产日益全球化促进了这一增长(联合国贸发组织2008)。同期,初级产品的出口增长更快,这很可能是受到发展中国家高速发展时期的强劲需求所带动。
In 2008,,The world manufacturing amounted to us $12.095 trillion peak(See table 1),The growth of more than 2005 ~ 2009 years manufacturing and added value of GDP.Trade liberalization/A decline in the cost of transportation and the globalization of production to promote the growth(The United Nations MaoFa organization 2008).Over the same period,Primary products export growth faster,This is may be influenced by developing countries high speed development period which is driven by strong demand.
2005~2008年间,发达国家制造业出口增长了11.0%,达到7.542万亿美元。2009年,受危机影响,发达国家制造业出口下降至5.792万亿美元(参见表2以及后文中的表4)。在发展中国家,制造业出口同期增长了17.3%,在2008年达到4.554万亿美元的峰值,而在2009年下降至3.699万亿美元。
From 2005 to 2008,The developed countries manufacturing export growth by 11.0%,Us $7.542 trillion.In 2009,,Influence by the crisis,The developed countries manufacturing exports fell to $5.792 trillion(See table 2 and the text of the table 4).In developing countries,Manufacturing exports increased by 17.3% over the same period,$2008 in 4.554 trillion peak,In 2009 fell to $3.699 trillion.

发展中国家在世界制造业出口中的份额也由1992年的20.4%增至2000年的29.4%,到2009年这一比重达39%,增速高于发达国家(参见图1)。由于发展中国家提高了制造业产能,并且随着更多的制造业选择在这些区域进行生产活动,生产成本随之下降,这一增长趋势仍可能持续下去。
Developing countries in the world share of manufacturing export from 20.4% in 1992 to 29.4% in 2000,By 2009 the proportion of 39%,Grew faster than the developed countries(See figure 1).Due to the developing countries improve the manufacturing capacity,And with more and more manufacturing selection in the area of production activities,Production costs fall subsequently,This trend is likely to continue.

世界制造业出口由中高技术产品所主导,如通信设备、客运车辆、办公设备及医药等。1992年以来,中高技术产品在世界制造业出口中所占的比重保持在60%以上,2000年达到64.3%的峰值(图2)。2000年以后,这一比重有所下降,主要原因是2001~2008年间高技术产品出口每年下降2.4%。在此期间,资源类产品的比重每年增长2.9%,而低技术产品的比重保持相对稳定。
The world manufacturing export high technology products dominated by,Such as communication equipment/Passenger vehicle/Office equipment and medicine, etc.Since 1992,The high technology products in the world manufacturing exports the proportion to stay above 60%,2000 to 64.3% of the peak(Figure 2).2000 years later,This proportion fell,The main reason is 2001 ~ 2008 high technology products exports fell by 2.4% each year.During this period,The proportion of resources products grew by 2.9% a year,And the proportion of low technology products remained relatively stable.

2009年,发展中国家在世界中高技术出口中的比重占35%。尽管发达国家在中高技术产品出口中仍占60%以上,但是发展中国家也有所进展,提高了出口技术复杂性,获取了更高的市场份额(图3)。2009年,发展中国家有54.8%的出口是中高技术产品出口,比1995年增长了48.6%。
In 2009,,Developing countries in the world of high technology exports accounted for 35% of the proportion of.Although the developed countries in the high technology products exports still accounts for more than 60%,But developing countries are making progress,To improve the export technical complexity,Get a higher market share(Figure 3).In 2009,,Developing countries have 54.8% of export is the high technology products export,With an increase of 48.6% than 1995.
在2005~2009年间,最活跃的20种制成品(即年增长率最高的产品)中有12种是资源类产品或是低技术产品(表3)。排在前三位的出口产品(贵金属、铁矿石和办公设备)的年均增长率达25%以上。像钢铁、铜、其他金属以及非金属矿等资源类产品活跃的原因可以解释为来自中国和印度等国家为满足金属密集型建设和汽车工业需要而带来的高需求。这一趋势为低收入及中等收入的资源丰富型国家开辟了一扇大门,这些国家可能会利用这些商品价格不断上涨带来的压力。2005~2009年间,发展中国家在活跃产品出口中的比重平均为47.3%,比2000~2004年间增长了41.7%。从总出口额来看,一项资源类产品(石化产品,9860亿美元)在2009年排名第一位,其次是中技术产品(造船,2830亿美元)及一项高技术产品(医药,2460亿美元)。(未完待续)
In 2005 ~ 2009,The most active 20 kinds of manufactured goods(That is the highest annual growth rate of the products)In 12 is a resource products or low technology products(Table 3).The top three export products(Precious metals/Iron ore and office equipment)With an annual growth rate of more than 25%.Like iron and steel/copper/Other metals and non-metallic mineral resource products active of the explanation may be from China and India and other countries to meet metal intensive construction and automotive industry needs and bring high demand.This trend for low-income and middle-income countries rich resources type opens a door,These countries are likely to use these commodity prices bring pressure.From 2005 to 2009,Developing countries in the proportion of active products are exported to an average of 47.3%,More than 2000 ~ 2004 increased by 41.7%.From the total exports to see,A resource products(Petrochemical products,986 billion dollars)In 2009 ranked the first,The second is the technical products(shipbuilding,283 billion dollars)And a high technology products(medicine,246 billion dollars).(To be continued)


亲稳链接:链接亲民维稳,践行稳中求进!
- 中欧贸易需要宏大视角--亲稳舆论引导监测室
- 外贸企业转战新兴市场--亲稳网络舆情监控室
- 中国光伏企业抱团抵制贸易保护主义--亲稳舆论引导监测室
- 中国进出口银行加大对国际船东融资支持力度--亲稳舆论引导监测室
- 中日贸易受影响 安倍访问缅甸打经济牌--亲民维稳网络舆情监测室
- 美国贸易保护现两大新趋势--亲稳舆论引导监测室
- 汽车进口量6个月来首次正增长--亲民维稳网络舆情监测室
- 今年就业需求前三位专业--亲稳网络舆情监控室
- 推进港澳内地贸易自由化--亲稳网络舆情监控室
- 印尼煤在低热值煤进口贸易中受限影响最大--亲民维稳网络舆情监测室
- 欧盟贸易专员称中国在全球贸易中“搭便车”--亲稳网络舆情监测室
- 贸易保护两败俱伤--亲稳网络舆情监测室
- 4月贸易增长远超预期 大规模热钱围城?--亲稳舆论引导监测室
- 进口食品涉嫌犯罪会被追究刑事责任--亲稳舆论引导监测室


